Analytics & Reports
OpenCLM's Analytics module gives legal, procurement, and finance teams the data they need to measure contract performance, spot risks, and make evidence-based decisions.
Accessing Analytics
Click Analytics in the left sidebar.
Overview Metrics
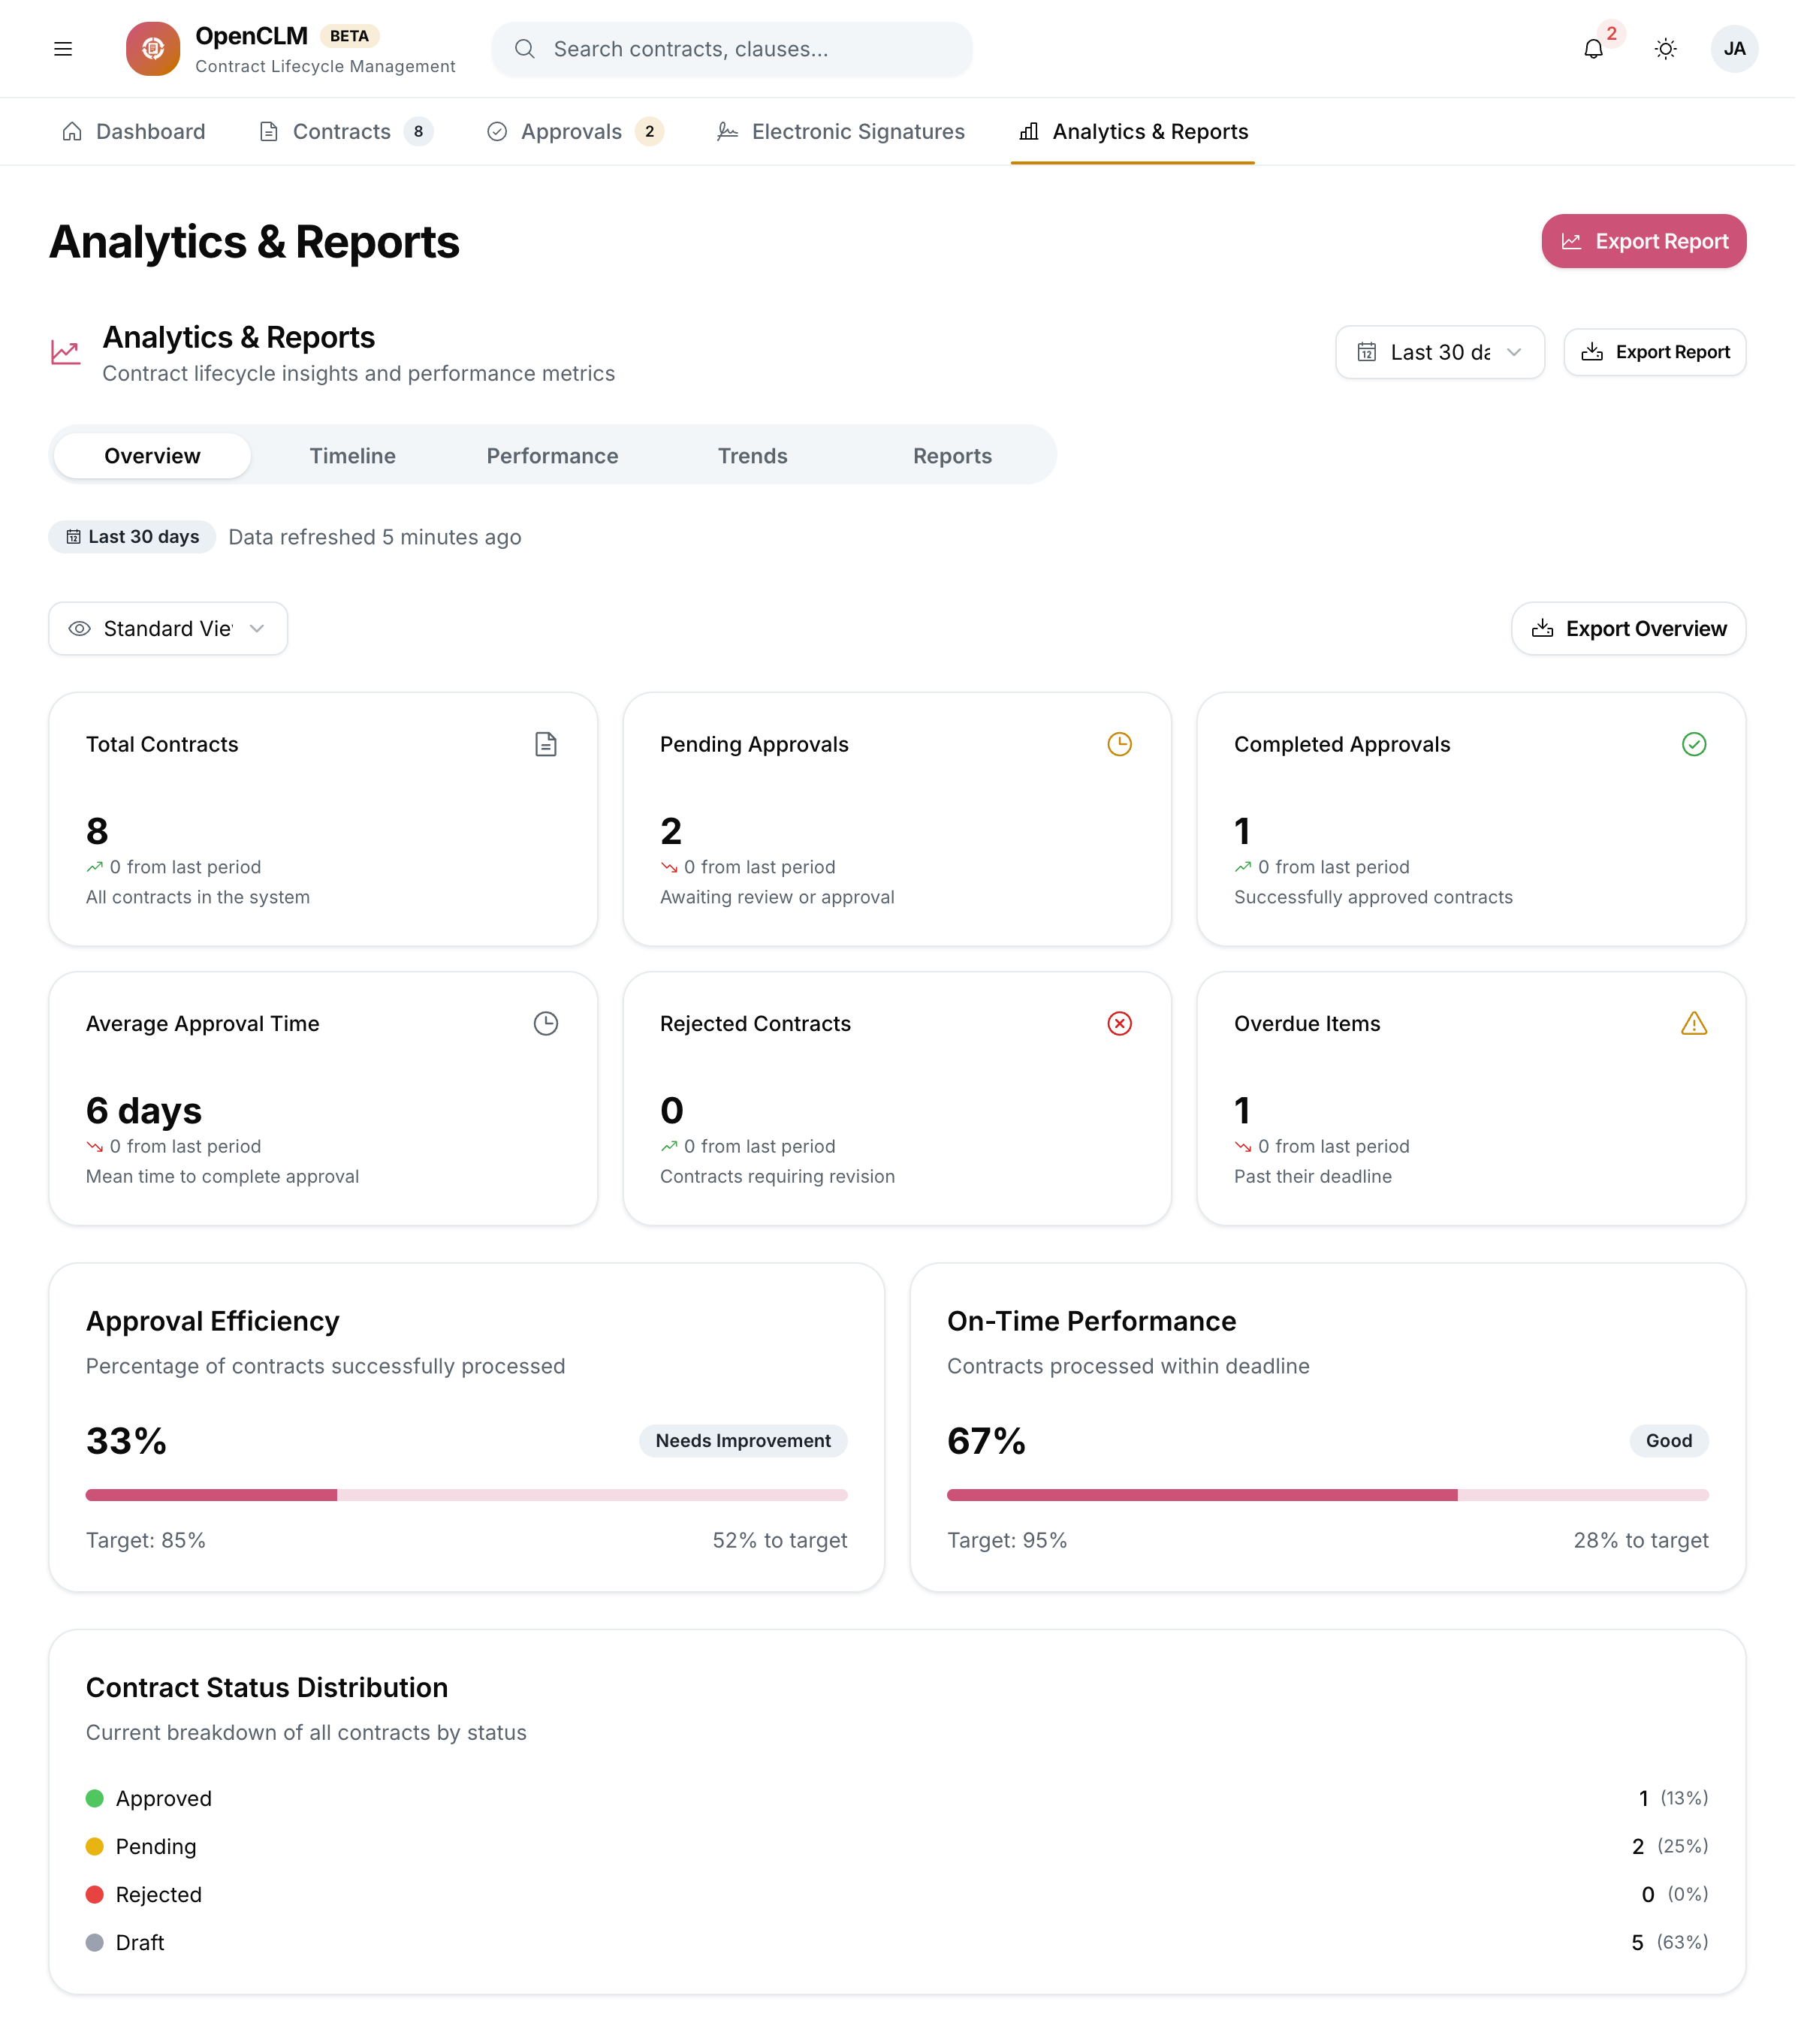
The top of the Analytics page shows KPI cards:
| Metric | Description |
|---|---|
| Total Contract Value | Sum of values of all active contracts |
| Contracts Created (Period) | New contracts in the selected date range |
| Avg. Approval Cycle Time | Average days from submission to approval |
| Avg. Time to Signature | Average days from approval to fully signed |
| Contracts Expiring (90 days) | Count of contracts expiring in the next 90 days |
| Renewal Rate | % of expired contracts that were renewed |
Use the date range picker (top-right) to change the analysis period: Last 30 days / Last 90 days / Last 12 months / Custom.
Charts & Visualisations
Contracts by Status
A doughnut chart showing the distribution of contracts across: Draft, Under Review, Approved, Signed, Active, Expired, Terminated.
Contract Volume Over Time
A bar chart showing the number of contracts created per month / quarter.
Contract Value by Type
A stacked bar or pie chart showing how contract value is distributed across contract types (NDA, Vendor, SLA, etc.).
Approval Cycle Time Trend
A line chart showing average approval cycle time per month — useful for identifying process improvement opportunities.
Top Counterparties by Contract Volume
A bar chart of your most common counterparties, sortable by contract count or total value.
Contracts by Department
A heatmap or bar chart showing contract volume by department / business unit.
Obligation Compliance Rate
% of obligations fulfilled on time vs. overdue — tracked per month.
Performance Charts
The Performance tab shows SLA compliance metrics for your approval workflows:
- % of approvals completed within the workflow SLA.
- Step-by-step breakdown of where bottlenecks occur.
- Approver response time league table (anonymised for non-admin users).
Trend Analysis
The Trends tab identifies patterns:
- Month-over-month contract volume growth.
- Types of contracts growing fastest.
- Counterparties with increasing or decreasing contract activity.
- Seasonal patterns in contract creation or expiry.
Custom Reports
Build your own reports in the Reports tab:
- Click New Report.
- Choose Report Type: Contract list, Obligation list, Approval history.
- Select Columns to include.
- Set Filters: Date range, status, type, owner, department, value range.
- Choose Sort order.
- Click Preview to see the data.
- Click Save Report to save for reuse, or Export to download as CSV / PDF.
Saved reports appear in your My Reports list and can be shared with other users.
Scheduled Report Delivery
Admins and users with the reports:export permission can schedule reports to be emailed automatically:
- Open any saved report.
- Click Schedule.
- Set frequency: Daily / Weekly / Monthly.
- Add recipient email addresses.
- Click Save Schedule.
Recipients receive the report as a CSV attachment.
Who Can Access Analytics?
| Role | Access level |
|---|---|
| Super Admin, Administrator | Full organisation-wide analytics |
| Contract Manager, Finance Controller, Procurement Manager | Organisation-wide analytics |
| Department Head | Their department's data only |
| Legal Counsel, Auditor | Read-only full analytics |
| Contract Author, Reviewer | Their own contracts only |